Are you the trendy type? Do you wear the latest fashion, have a presence on the latest social media app (I see you, Tik Tok), listen to the number one songs on the radio, see the latest movie? Trends are like that; they are the original memes where something hits and hits hard. And then in 1 year, 3 years, 5 years, 10 years, no one remembers them.
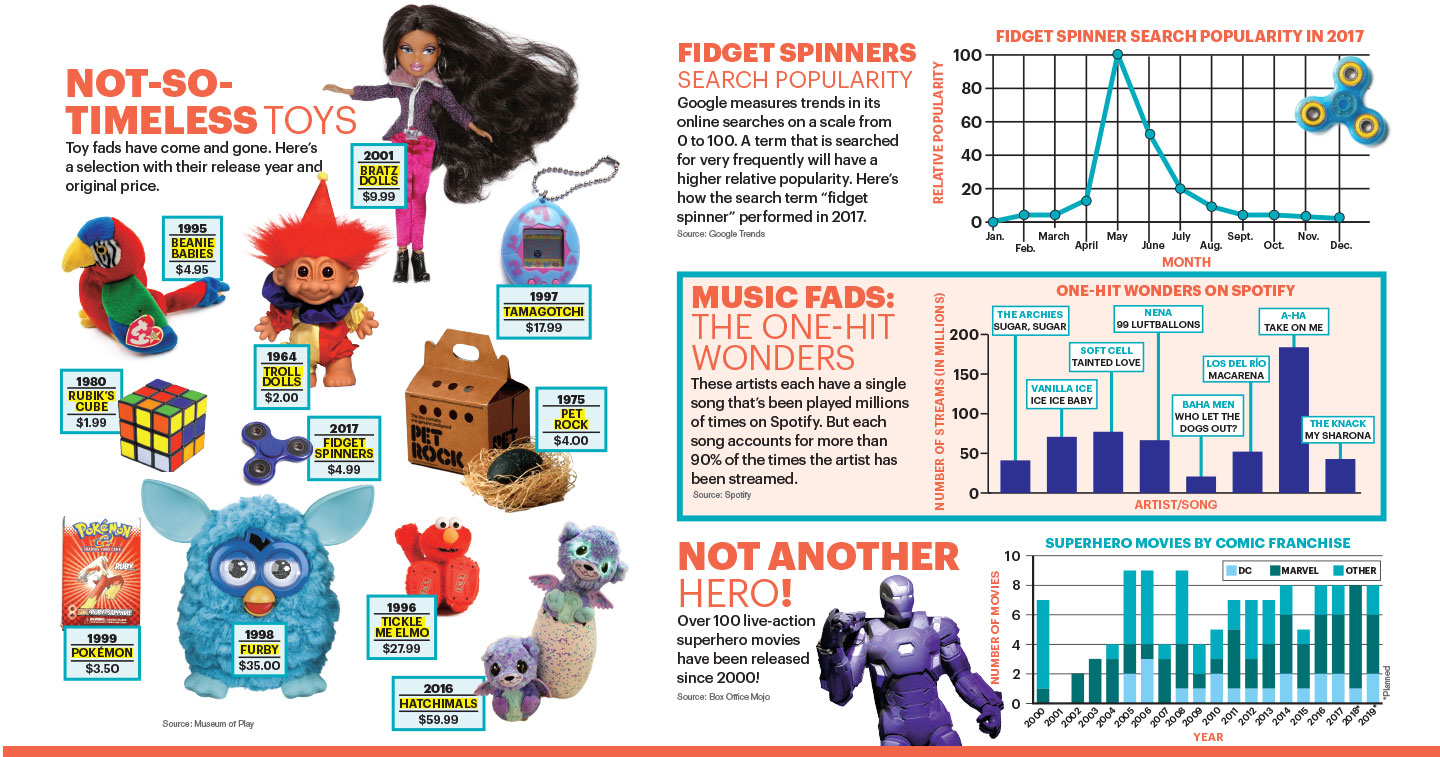
Rest in Piece Rubik’s Cubes, Pet Rocks, Tamagotchies, Fidget Spinners, Pokemon Go… you can fill in the blank.
Now don’t misunderstand me. Trends aren’t all bad. When everyone is focused on one product or idea, then that idea or product gains nearly universal acceptance. For a moment, everyone agrees that it is “in” (or “hot” or “cool” or “ill”). As you can see, even language can have trends!
So what does any of this have to do with financial aid? Bear with me, I’m getting there…
Every year, the College Board (yes, that College Board) releases several publications about college pricing and financial aid. You know about the College Board because of their work with the SAT, AP examinations, and – yes – the College Board’s CSS Financial Aid Profile, but I bet you’ve never seen their Trends publications. (See what I did there?)
There is a lot of great information in the three annual Trends in Higher Education series, but today I am going to focus on the information specifically from Trends in Student Aid.
I want to look with you at one particular table because I think it is really important to understanding how financial aid works, and how I manage this blog. This table visible below is Total Student Aid and Nonfederal Loans for Undergraduate and Graduate Students in 2017-18 and is expressed in millions on dollars adjusted for inflation.

If you look at the 2017-18 line in the chart, you will see some interesting things. First, who offers more grant or scholarship financial aid every year, the Federal government, State governments, Private sources (like scholarship agencies), or colleges and universities? Well, looking at this chart we can answer this. Colleges and Universities offer far more in grant and scholarship aid (in 2017-18, over $60 billion) than any other source (the Federal government offered $41.6B in 2017-18 and all states in the US combined only offered $11B combined).
Another important lesson from this chart has to do with student and parent loans. While it is certainly true that students and parents borrow a lot to support their own investment in higher education, it is not the primary source of funding for college. Even including graduate borrowing (represented by the Graduate PLUS in the table above), the total borrowing of students and parents in 2017-18 was $105.5B ($93.9B from Federal Loans and $11.6B from nonfederal loans). This represents less than half of the total money available for financial aid. Now, I am not arguing that this number shouldn’t be reduced (I would love more grant assistance for students), but I often hear people complaining that financial aid is all loans, and this chart shows that isn’t true.
As you look at this chart, what questions do you have? What do you find surprising? What information fits with what you thought about the national financial aid picture? Post your thoughts below.
And what trend should be next on the list?
